(This page is still under development)

Executive Summary
Partnered with Johnson & Johnson’s Cerenovus division to address customer retention challenges in the neurovascular device market. At the outset, we matched J&J’s transactional sales data with third-party medical databases to enrich customer profiles and validate insights, while also developing exploratory dashboards in Power BI and Tableau to surface initial trends. As the project evolved, the team transitioned to a full-stack approach: SQL for scalable data integration, Python for feature engineering and predictive modeling, and React with Tailwind for an interactive dashboard. This end-to-end solution brought together customer segmentation, churn prediction, and product migration analysis in a single platform, enabling business teams to move seamlessly from data exploration to strategic decision-making.
Key Outcomes
-
Strong Predictive ModelNULL
-
Focused Risk TargetingNULL
-
Business Value CreationNULL
-
Retention Strategy ImpactNULL
Objectives
- Predict Customer Churn: Develop models to identify which hospital or account is most at risk of leaving, enabling Johnson & Johnson to prioritize retention actions before revenue is lost.
- Segment Customer Base: Use clustering to group accounts into meaningful profiles (e.g., High Revenue Contributors, Premium Spenders, Low Engagement) for tailored retention strategies.
- Analyze Product Migration: Track shifts from older coils/stents to aspiration systems, revealing physician preferences and informing product portfolio planning.
- Quantify Financial Impact: Translate predictive accuracy and segmentation insights into projected ROI, linking data science outputs to measurable business value.
- Deliver Decision-Support Tools: Build interactive dashboards that connect churn predictions, segment profiles, and ROI scenarios, giving managers a clear path from insight to action.
Data & Features
-
Transactional Data Sources: Multi-year sales transaction tables containing
FISCAL_YEAR,FISCAL_MONTH, revenue (SALES), product SKU and category, sales channel (distributors, direct), and geographic region. These served as the foundation for all modeling and segmentation. -
Feature Engineering: Derived business-relevant metrics including:
- RFM metrics (Recency, Frequency, Monetary) to capture customer behavior patterns.
- Seasonality features (quarterly and monthly dummy variables) to account for cyclical purchasing behavior.
- Product mix ratios to measure migration trends (e.g., coils → stents → aspiration systems).
- Pricing tiers and discount bands to capture value sensitivity across accounts.
- Recency windows (e.g., 3-, 6-, 12-month lookbacks) to measure recent activity and inactivity.
-
Data Quality & Standardization: Applied systematic cleaning steps:
- Standardized product and channel naming across multiple source systems.
- Handled missing values through imputation and logical rules (e.g., defaulting null channel codes).
- Detected and capped outliers (e.g., unusually large one-off purchases) to prevent model distortion.
- Cross-source alignment between transactional, regional, and product hierarchy tables to ensure consistency.
- Final Feature Set: Combined raw transactional metrics and engineered variables into a structured dataset ready for churn modeling, clustering, and dashboard integration.
Methods
- Data Preparation: Standardized multi-year transactional data (FISCAL_YEAR, FISCAL_MONTH, SALES, SKU, region, channel). Engineered RFM features (Recency, Frequency, Monetary value), product mix ratios, migration indicators, and seasonality flags.
-
Predictive Modeling:
- Logistic Regression as baseline for interpretability and quick benchmarking.
- XGBoost for high-performance classification, capturing nonlinear interactions and handling imbalanced churn outcomes.
- Random Survival Forest (RSF) to estimate time-to-churn, providing survival probabilities over time.
- Model Evaluation: Used ROC-AUC and Precision-Recall AUC to measure classification power, C-Index for survival analysis accuracy, and cost-benefit curves to test ROI under different marketing budget constraints.
-
Customer Segmentation: Applied K-Means clustering on engineered features. Identified distinct groups:
- Premium Spenders – high ticket size, ideal for exclusive offers.
- Power Buyers – frequent purchases, responsive to loyalty programs.
- Low Engagement – low spend and low frequency, requiring reactivation campaigns.
- Visualization & Decision Support: Developed interactive dashboards (React + Tailwind + PostgreSQL) to connect predictions with segmentation and campaign planning for Johnson & Johnson managers.
Business Impact
- Customer Retention: Early identification of high-risk accounts enabled targeted outreach strategies. Our models captured over 60% of churners in the top-risk deciles, ensuring sales teams can focus efforts on the most vulnerable accounts.
- Revenue Protection: Conservative ROI scenarios projected an annual impact of +$1.2M through optimized retention campaigns, proving that predictive analytics can directly translate into measurable financial value.
- Product Migration Insights: Analysis revealed a 45% migration from legacy coils/stents to newer aspiration systems (C71 series). This highlighted evolving physician preferences and informed product portfolio strategy.
- Strategic Segmentation: Customer clustering uncovered distinct profiles—High Revenue Contributors, Low Engagement, and Premium Spenders— giving marketing teams actionable levers for personalized messaging and differentiated retention offers.
- Decision-Support Tools: Delivered an interactive React + Tailwind + PostgreSQL dashboard that closes the loop (prediction → segmentation → campaign design → monitoring), enabling managers to make real-time, data-driven decisions.
- Long-term Impact: Established a repeatable data pipeline and modeling workflow that can be extended beyond Cerenovus to other Johnson & Johnson divisions, strengthening enterprise-wide analytics capability.
Demo Video
Watch a short demo showcasing the interactive dashboard.
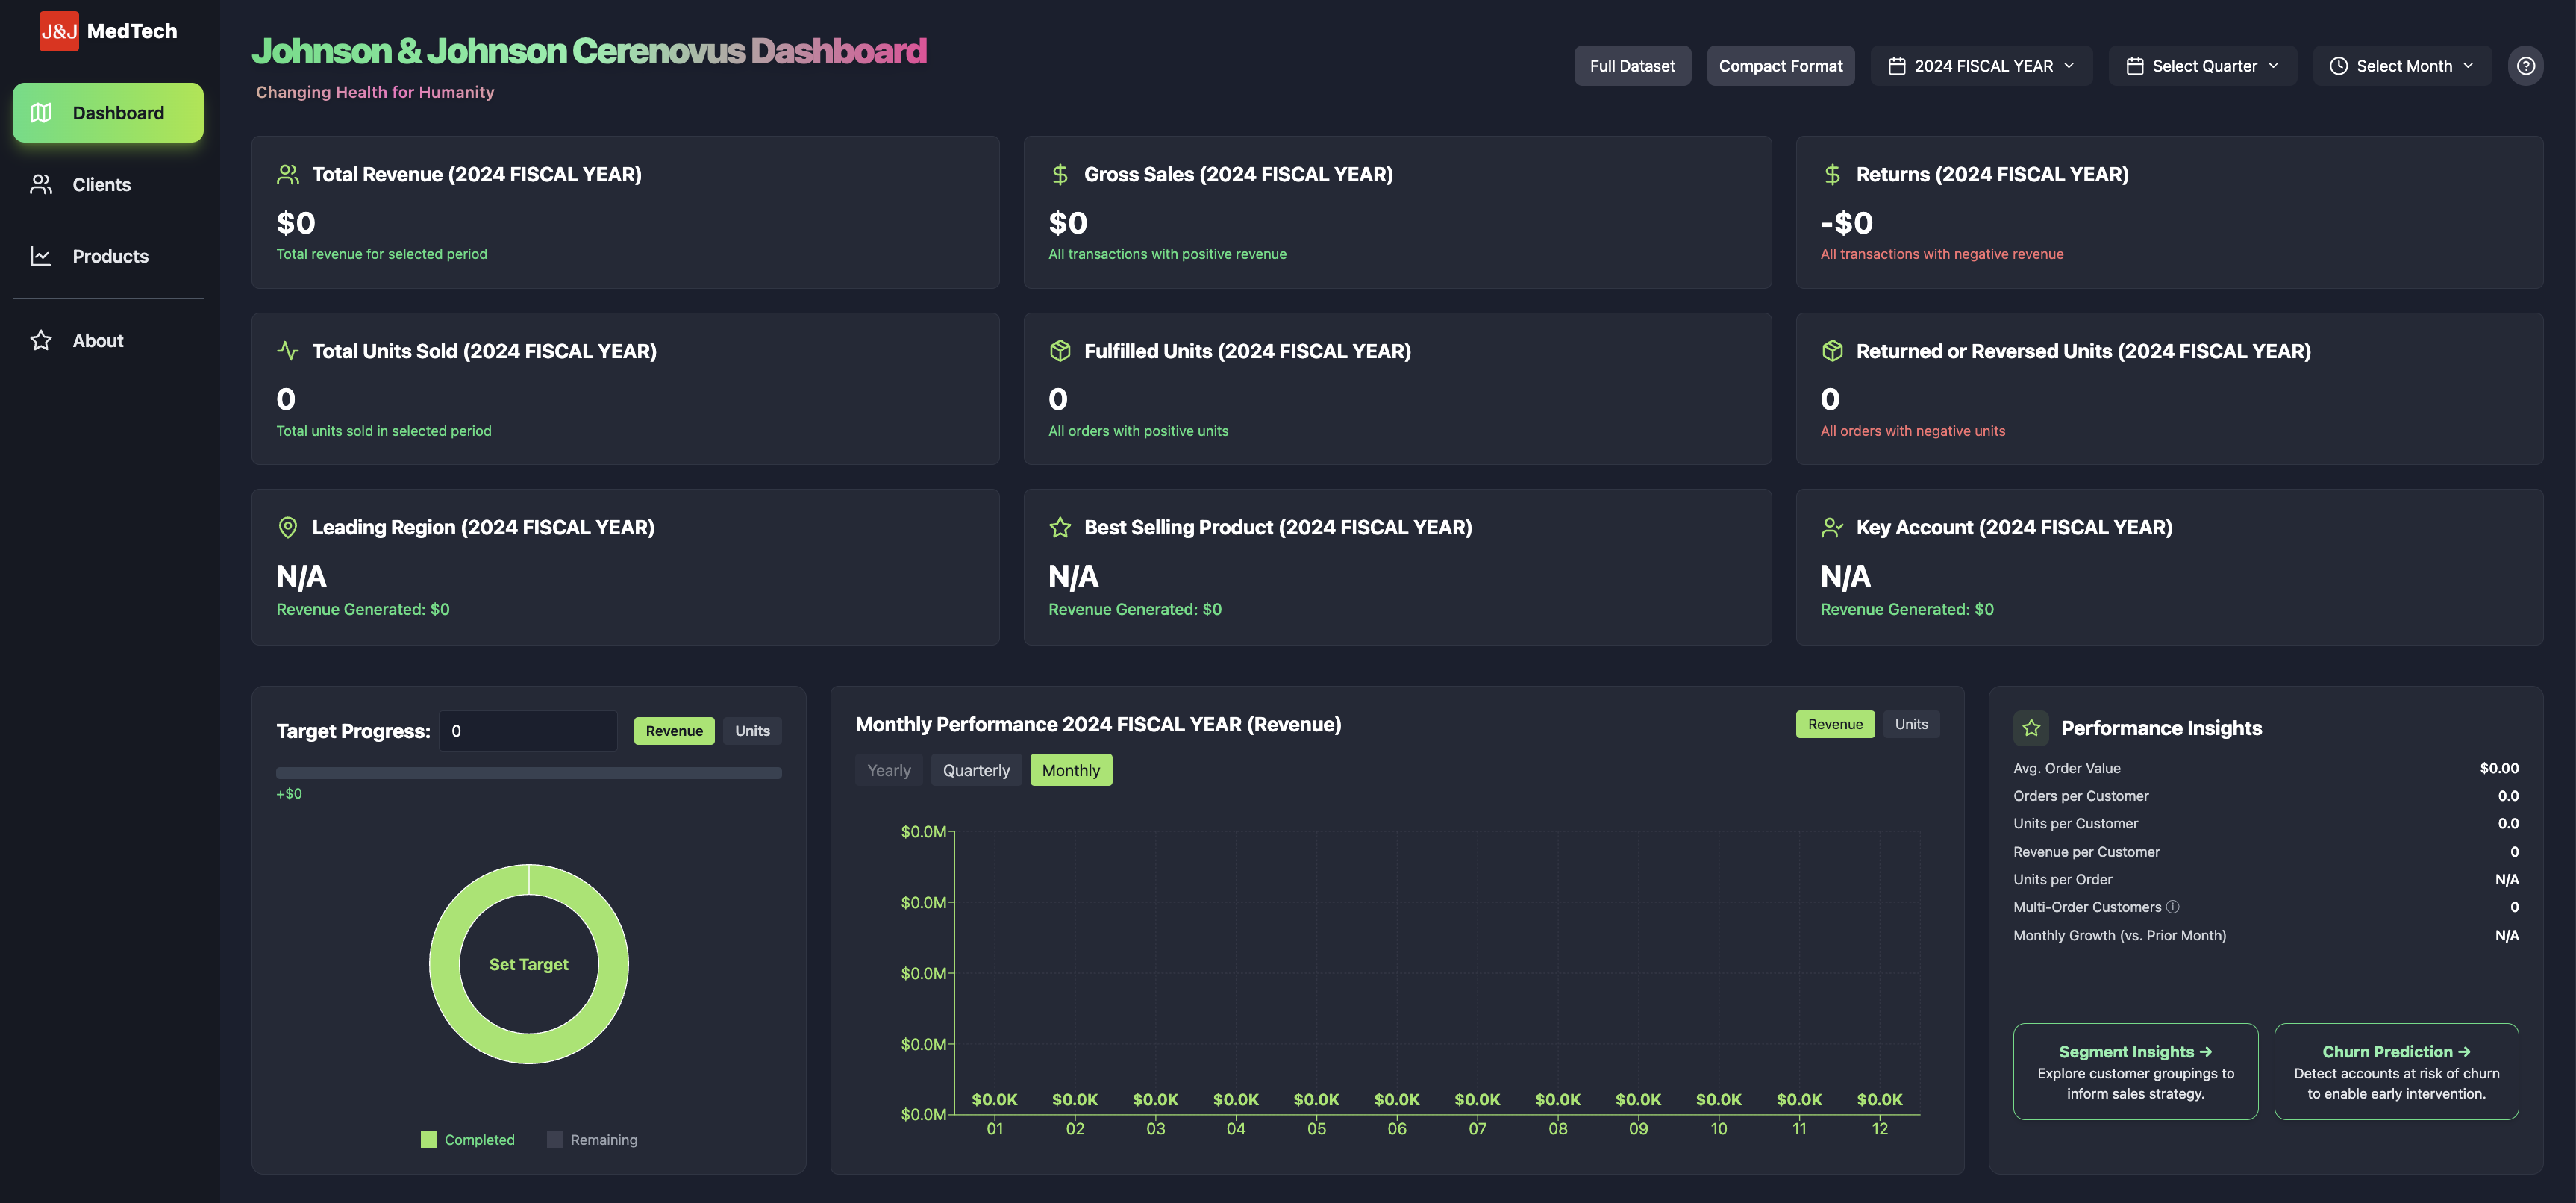
Interactive Dashboard
Built an end-to-end dashboard to visualize churn predictions, customer segments, and retention ROI scenarios.
Documentation
Select a deliverable and click “Open”: